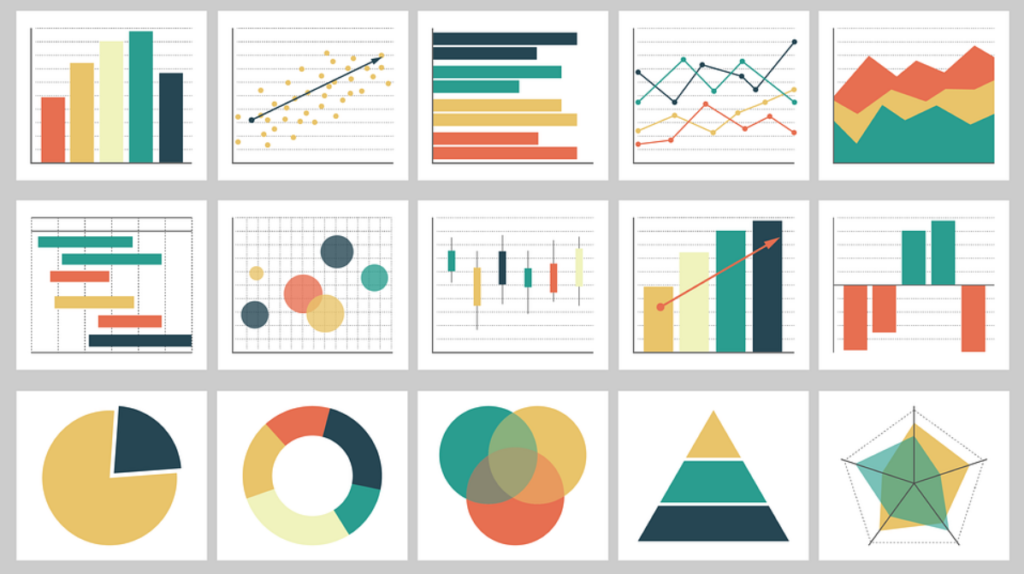
The objective of this group is to conduct research, development, and innovation in the fields of Visualization and Visual Analytics.
Visualization is the process of generating visual representations of data to support understanding and the subsequent extraction of information and knowledge.
Interaction enables the use and manipulation of these visual representations and serves as an essential aid for humans to perform complex and cognitively intensive tasks.
Visual Analytics combines automated analysis with interactive visualizations to facilitate effective understanding, reasoning, and decision-making based on large and complex data sets.
Current areas of work include:
- Visualization of Large-Scale Data
- Visualization of Spatial, Temporal, and Spatio-Temporal Data
- Visualization of High-Dimensional Data
- Interaction in Visualization
- Situated Visualization
- Comparative Visualization
- Visual Analysis of Data in Geosciences
- Visual Analysis of Data from Eye-Tracking Devices
Webpage: vyglab@cs
Team
Head: M. Luján Ganuza
Researchers
- Osvaldo E. Agamennoni – IIIE (UNS-CIC),
- Lucía Asiain – INGEOSUR (UNS-CONICET),
- Ernesto A. Bjerg – INGEOSUR (UNS-CONICET),
- Jessica Carballido – ICIC (UNS-CONICET),
- Silvia M. Castro – ICIC (UNS-CONICET),
- Georgina Cerúsico – UNCa
- Sebastián Escarza,
- Gabriela R. Ferracutti – INGEOSUR (UNS-CONICET),
- María Florencia Gargiulo – INGEOSUR (UNS-CONICET),
- Alejandra Herrera – UNCa
- Martín L. Larrea – ICIC (UNS-CONICET),
- Sonia V. Rueda,
- Matías Selzer – ICIC (UNS-CONICET),
- Dana K. Urribarri – ICIC (UNS-CONICET).
Doctoral Fellows
- Antonella Antonini – ICIC (UNS-CONICET),
- Leandro Luque – ICIC (UNS-CONICET),
- Juan Tanzola – INGEOSUR (UNS-CONICET).

